Year-over-year trending
Compares this year to last and flags which assets are getting worse — a watch-list you can act on before failure.
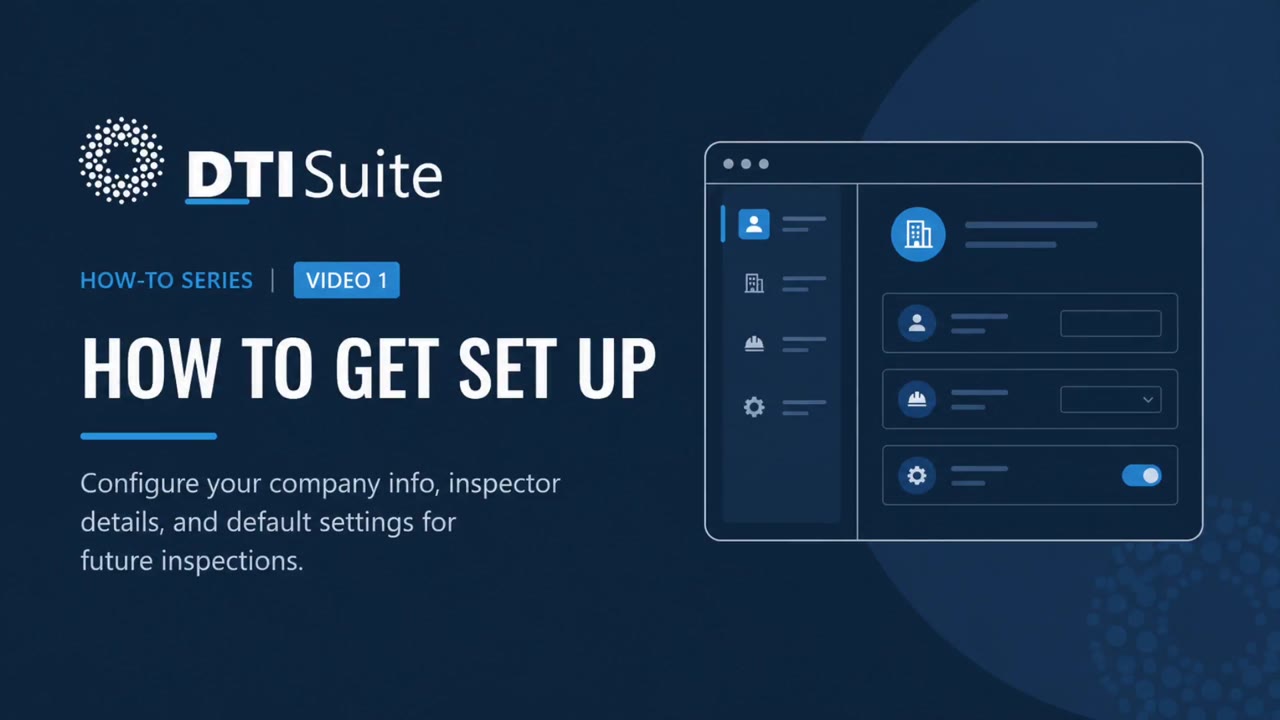
DTI Suite turns your asset spreadsheet and radiometric photos into a polished, standards-ready electrical infrared report in Microsoft Word. Import the data, edit your photos, build the Word draft, review it, and finalize the PDF — the report is written from your list and photos, so nothing is typed twice.






Every thermal camera ships with report software you didn't choose — and it's why the report is the worst part of the job.
You picked the camera. The clunky, dated report tool came bundled — and you're stuck using it, like it or not.
Endless load times, frozen windows, and work you lose right when you're trying to get the report out the door.
You wrestle the software to produce something unique and professional — then do it all over again on the next job.
Cold data in, white-hot report out — the same scale your camera speaks.
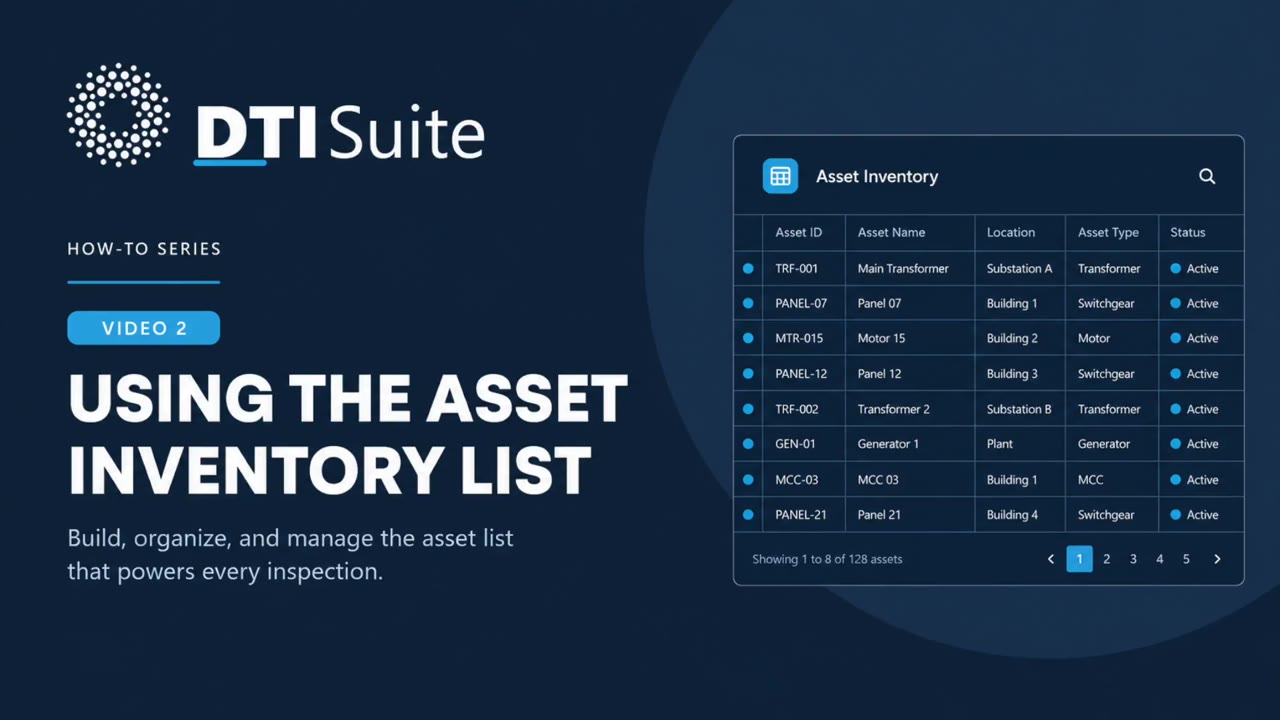
The asset inventory becomes the report's backbone.
Radiometric photos auto-pair to their assets.
Markers, ΔT and palettes — analysis happens on the image.
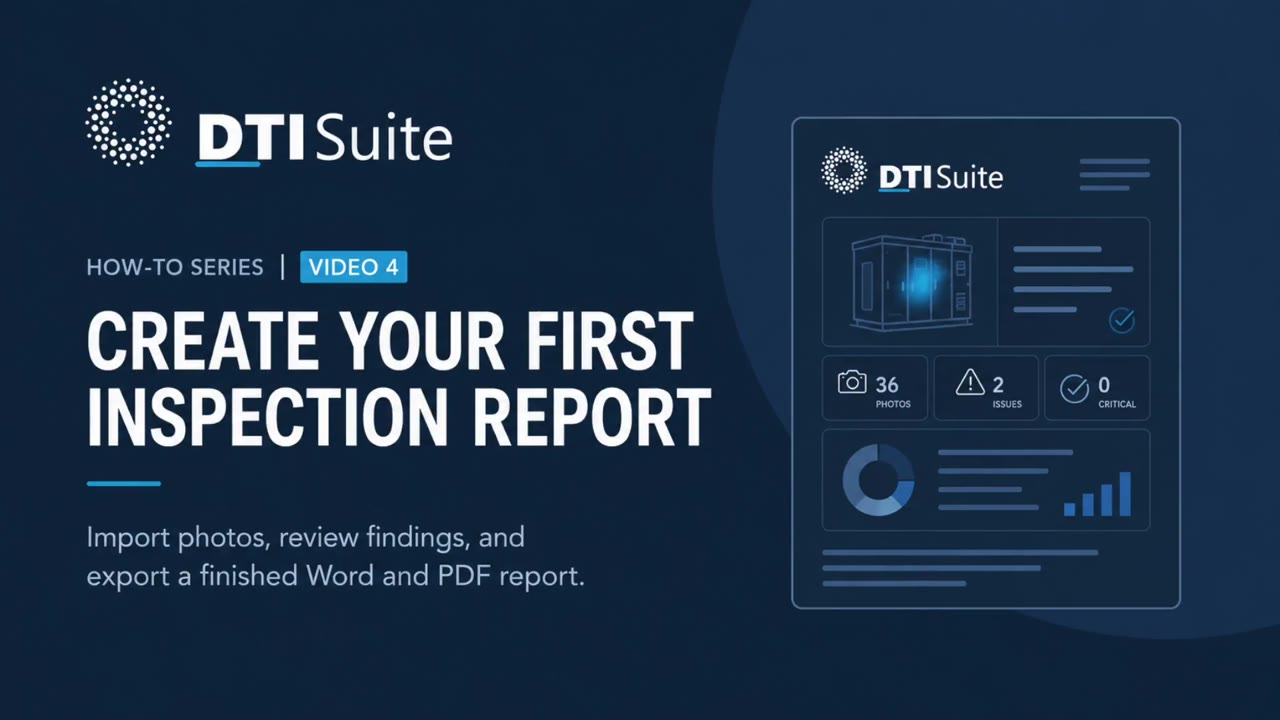
A review-ready Word draft, then the final PDF — you check it, DTI Suite writes it.
Setup, the inventory workbook, and inspection to finished report — recorded in the real app.
Every page is generated automatically from your spreadsheet and photos: thermal-and-visual image pairs, measured temperatures, severity analytics, and compliance language.


Sample pages and report generated by DTI Suite from demonstration data.
Three things set a DTI Suite report apart — then a dozen more.
Assets scanned, anomalies by severity, and how many need immediate repair — a clean executive overview up front, so the value of the inspection is obvious in ten seconds.
Compares this year to last and flags which assets are getting worse — a watch-list you can act on before failure.
Condition-based re-inspection intervals and next-due dates, aligned to NFPA 70B and CSA Z463.
Shows the report meets what insurers and AHJs expect — at a glance.
Edit FLIR, HikMicro, Fluke, Testo & Raytron spot and box markers, read ΔT, switch palettes and overlays.
Real .docx and PDF. No LibreOffice, no web upload of your files — photos and workbooks stay on your PC.
Same inspection. A fraction of the desk time.
Thermography finds loose connections, overloads and imbalances before they fail — and the standards now expect you to document it.
NFPA 70B became a standard — electrical maintenance and infrared inspection moved from "recommended" to required practice.
NFPA 70B, 2023 editionA connection running 10–20 °C above reference carries roughly a 60% chance of failure within 90 days.
NETA / industry temperature-rise benchmarksIR scanning is done under load, energized — catching faults live, without taking equipment offline.
Standard IR inspection practiceGenerated automatically — no template wrangling.
| Report section | What it does for you |
|---|---|
| Management summary | Executive overview: assets scanned, anomalies by severity, how many need immediate repair. |
| Insurance checklist | Confirms the report meets what insurers and AHJs commonly require. |
| Per-asset photo pages | Paired thermal + visual images, measured temperatures, parameters, problem & recommendation, technician notes. |
| Repair summary | Every flagged anomaly, sorted worst-first, with page references. |
| Severity matrix | Findings plotted on a severity × criticality grid to focus the work. |
| Year-over-year trend | Which assets worsened since last year — a predictive watch-list. |
| Re-inspection schedule | NFPA 70B / CSA Z463 intervals with next-due dates from the inspection date. |
| Full asset inventory | Every piece of equipment scanned, with rating, severity and criticality. |
I'm an electrical thermographer. I was sick of report software that was slow, clunky, and made me bounce between four programs to produce one report — and the result still looked mediocre. DTI Suite is the first tool that gets me from photos to a finished report in one sitting.
Start with a 30-day free trial — every feature included, no credit card. Build your next report in minutes.
Start your free trial →